Why Are We Late? How Do We Increase Throughput?
Humans are terrible at understanding feedback loops
In The Goal it is stated that businesses have about 80% waste. This means for every 100 spent only 20 delivers value. This sounds surprisingly high. By the time you read the following I think you will suspect this is low for the operational processes involved in designing, building, delivering, running and maintaining software.
We know people are bad at understanding the effects of compounding. We have debt, interest rates, pandemics, perception of risk as all being great examples.
What these things all have in common is multiplication rather than simple addition - which we are very good at intuiting. It is funny how adding a single line on a drawing changes the category of the problem and thus causes all of our intuition to suddenly work against us. It looks to innocuous. Multiplication is addition with a feedback loop. If we have a process that is a line of boxes, and we add an arrow connecting later back to an earlier state this transformation takes place. You have changed the category of the problem.
Add 1 onto something 5 times … and do that 5 times … is 25 operations. We had to learn tables by rote to cope with this and spend thousands of years developing a syntax with rules to allow us to reason with it. I think we all dread doing manual long division for this reason (find square roots).
It turns out that operational processes are full of examples of this - because a feedback loop (Eg work getting rejected) causes a system that was once additive to become multiplicative. The ramifications of adding a single feedback line into a diagram are such that you need a completely different mindset. Personally I think this is why games like the penny game work
This is why your project takes too long and costs too much money. You likely use additive tools in a multiplicative world because human intuition hides the complexity - but that complexity is there.
Our goal should be to have methods that produce predictable outcomes. If we cannot do this, then we cannot claim to have skill or expertise. When we have multiple methods with predictable results, we can choose what set of trade offs we desire based upon the context rather than simply deploy ‘best practice’.
After all we know there is one best colour (its purple).
Question 1
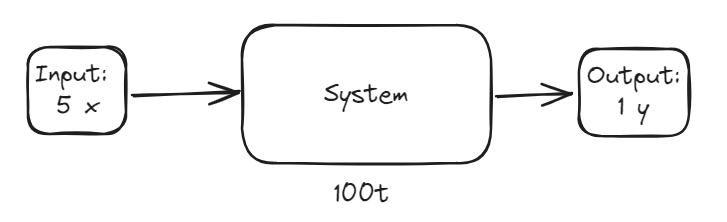
This is a diagram intended to show am input of 5x, a duration of 100 time with an output of 1y
If we have a system that consumes at a rate of 5 per minute and produces 1 per minute - how do we double its output?
Answer
The obvious(ly bait) answer is double the input - however this linear increase will not be possible forever. Also, there are likely answers that may not require scaling the input.
Question 2
What would the knock on effect of increasing input like this be?
Answer
If nothing else changed, then the duration of the system would increase. This is why doubling the input doesn’t work; we wanted to double the input and keep the duration constant - or within some as yet unspecified bound.
So it turns out that it wasn’t possible to answer that first question - just because questions read sense doesn’t mean they make sense. This is terribly important as the hardest job we have is to take questions from clients and construct the question they really want to ask but cannot because language is sequential in a non-sequential world.
So what is required to be able to ask this question?
In TDD when we are stuck on a problem we use triangulation where we solve a slightly different problem to help us push towards a more generalized understanding.
Question 3
What is the total Lead time of this system?
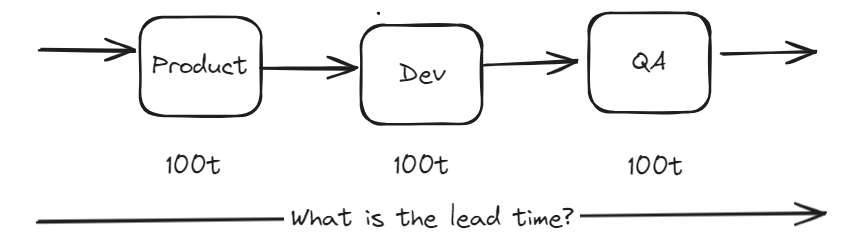
Answer
Please stop to think before reading on.
The answer is that we add the times for all the boxes together, and we arrive at the answer of 300 time.
Congratulations you have achieved the mathematical prowess of a 6-year-old (possibly younger, but I only have a 6yo to check with to make sure this makes sense).
Question 4
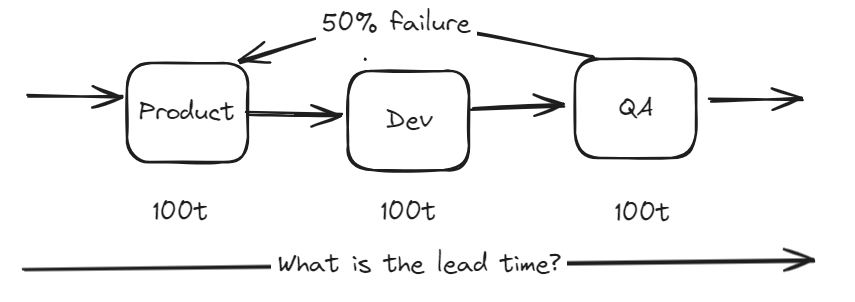
This is a 3 stage system where the final stage has a 50% failure rate that goes back to the start. Each stage takes 100 time.
What is the total lead time in this system?
Please stop and think here
Answer 4
Please can you write a number down for how long you think (or whatever answer you think is appropriate) - as I think for many readers things are about to get very interesting.
It is likely that some people now have a headache, but I get asked ALL THE TIME by delivery people how long something will take, and they think its completely unreasonable when I say ‘you have no idea what you are asking me!’. I usually handle this by asking ‘how long do we have?’ and then respond with what I think I can get done in that time to avoid the first question hoping that they go away thinking they got an answer.
So what was your answer? If it was a single number you are wrong. This problem only makes sense if you know ahead of time how many times you go around the feedback loop.
We can only answer this with statistics, I bet some readers have the mathematical skills to give me the answer to this. I do not, instead I wrote a piece of code to solve this problem. It is that complicated - it is a very long series.
The code I used can be found on github I created a simulator and ran it for 1,000,000 iterations to capture the statistics.
The output from my program reads like this
  {
      name: '3 tasks,100 duration, 3 has failure rate of 50%',
      mean: 599.7408,
      median: 600,
      mode: 300,
      max: 6300,
      iterations: 1000000,
      tasks: [
        { time: 100, failure: 0, name: 'product' },
        { time: 100, failure: 0, name: 'dev' },
        { time: 100, failure: 0.5, name: 'QA' }
      ]
    }
So most of the time it takes 300, on average though it takes 600. Half the time it takes between 300 and 600 time. Edit: This test is temperamental, at least 25% of the time the median is 600 the rest it is 300 - i do not factor that into here..
But the other half of the time it takes between 600 and 6300 - this is 20x longer than the modal estimate. That top end is 1 in a million though.
But half the time the expected result should be dramatically longer than estimated. That this is true and should be accounted for, not in estimates (the estimates are correct) but systemically because the delivery structure put in place has to have this property.
Estimate of work can be 100% accurate but in this system will deliver like this. To state it again, we do not want to change the estimate! - the estimates are correct.
The problem is that nobody can intuit that this system is not what they think it is.

I don’t think anyone had that answer - and if they did please leave a comment because would love to talk to you!
Question 5
So let’s model something more realistic, this time lets introduce a failure rate between dev and product. Sometimes developers get asked to do things that require them to reject the work and say ‘this doesn’t make sense, please try again’.
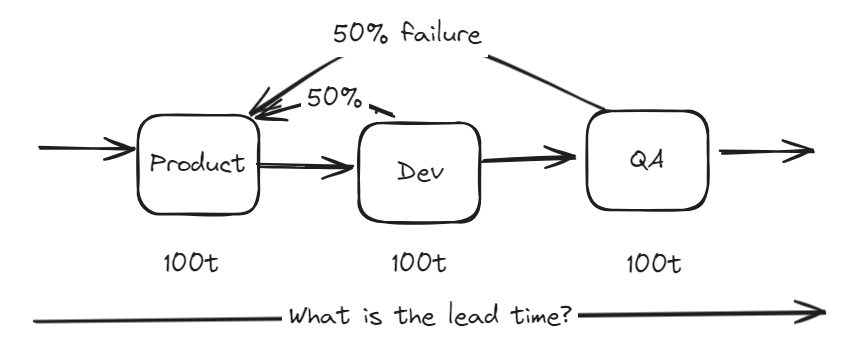
Again we have a 3 stage process, stages 2 and 3 both have 50% failure rate that goes back to start. Each stage takes 100 … what is the effect of the additional feedback loop on the system?
Again please try to write something down because I Was surprised when I worked it out!
Answer 5
  {
      name: '3 tasks,100 duration, 2+3 have failure rate of 50%',
      mean: 999.0069,
      median: 700,
      mode: 300,
      max: 11200,
      iterations: 1000000,
      tasks: [
        { time: 100, failure: 0, name: 'dev' },
        { time: 100, failure: 0.5, name: 'test' },
        { time: 100, failure: 0.5, name: 'nearest' }
      ]
    }
This is a process that looks like it should take 300. But if we randomly looked at a real example we would see the expected time now should be 1000. This is over 3 times as long. We can see that adding another feedback loop causes mean and median to start to drift.
Our maximum time is now almost 40x our modal expectation of 300.
This should be very scary. We only have a very simplistic problem here. We have 3 stages and only 2 opportunities for failure.
If we look at the typical engineering teams path to production we sequentially chain together maybe 7-8 steps. We have Business, UR, UX, BA, Product, Dev, QA, OAT, Security, Service, Production, Policy teams etc. The real world problem is much larger … if we put that in a sequence and ran it with even a 10% failure rate (which is sensationally low - failing programs expect most work to fail we will get onto why in later posts but here we are discovering where the pressure comes from), then I would expect the calculation to go from 1 second to many minutes and the answers to get very large. The reason why we don’t see ice-age sized answers in the real world is because we step in and kill the work writing it off as waste.
Why are your projects late? It’s because you cannot intuit just how dramatically different the system is to how we model work flowing through overly simplistic ways of tracking it in software that is not trying to help you see this problem.
Question 6
This is an example of how I think to refactor these systems.
If we take a 4 stage process where the final 3 stages have a 50% failure rate we get the following numbers
 {
      name: '4 tasks: dev, test, qa, int, 100 duration - 50% failure',
      mean: 2200.2782,
      median: 1600,
      mode: 400,
      max: 26000,
      iterations: 1000000,
      tasks: [
        { time: 100, failure: 0, name: 'dev' },
        { time: 100, failure: 0.5, name: 'test' },
        { time: 100, failure: 0.5, name: 'integration' },
        { time: 100, failure: 0.5, name: 'UAT' }
      ]
  }
for a process that we expect to take 400, the average is 2200 (almost 6x expectation), middle time is 1600 (4x) and max 26k (60x ish)
What happens if we do a simple refactor on the ways of working? If we got the dev team and the test team to pair / mob then we can move the test failure into the dev team and as a result of this collaboration move some QA insight from integration and UAT into dev lowering failure rate there
This would look like this
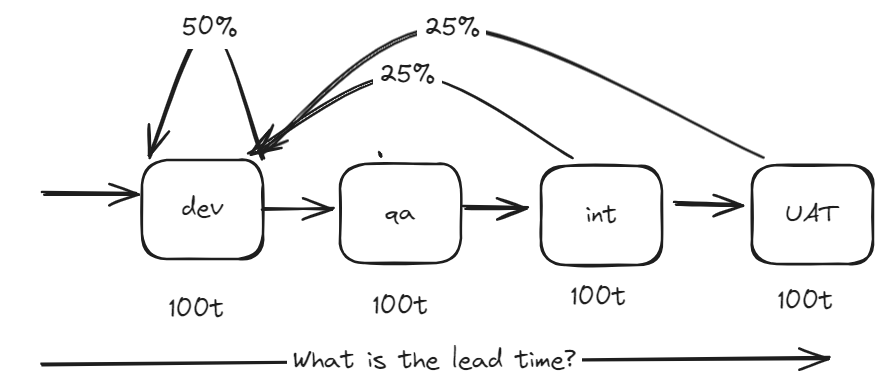
the results are
    {
      name: '4 tasks, dev (50%), qa (0%), int (25%), uat (25%)',
      mean: 844.5017,
      median: 700,
      mode: 400,
      max: 7800,
      iterations: 1000000,
      tasks: [
        { time: 100, failure: 0.5, name: 'dev' },
        { time: 100, failure: 0, name: 'qa' },
        { time: 100, failure: 0.25, name: 'int' },
        { time: 100, failure: 0.25, name: 'uat' }
      ]
    }
on average, it takes 844 (2x), middle 700 (2x) with a max of 7800 (20x)
which compared to before is
- mean 6x -> 2x
- median 4x -> 2x
- max 60x->20x
These numbers are tremendously different all from a fairly simple change and some assumptions.
The thing here is that half the time the range of results is between the mean and the max. Reducing this by 33% matters so incredibly much.
Conclusion
We should be measuring gross lead time, and we should be doing everything we can to reduce this number. I have found this to be true in non-engineering systems also.
If we want to double the output of a system we can see that there is tremendous waste, and really we just need to make a small dent in this waste in the right place to see a multiplicative effect that can transform the system.
This leads me to hypothesise that I can probably turn many millions of investment into transformation programs on their heads by simply throwing away the rule book because the rule book leads people into a way of thinking that we can see here cannot possibly scale - and we can look at a world of failing projects to see the supporting evidence.
If you cannot tell me how long it has taken a piece of work to get into production from inception to delivery - because you split up defects in different places, raise them as new work, and broke it into untraceable bits because you use terrible software to manage this stuff - then why do you think you can expect to hit any target?
I don’t care about your internal cycle times of different job roles. I only care about your gross lead time, we can work the rest out later by deciding what to measure with the specific objective of seeing the effect on gross lead time.
That the vast majority of engineering endeavours cannot tell their customers - or even see the value in this figure - because they do not measure this, and this is a complete disgrace. This isn’t an engineering failure, it is a failure of the system to put in place the measures that validate the effectiveness of roles that traditionally exist outside of Jira board / kanban boards. All the waste here comes from non-ticketed non technical roles not having the design pressure to get good at what they do and then to be able to ability to turn around and share the numbers and the story.
Honestly, I am writing this and have only managed to get this figure a couple of times in 20 years of doing this. The bar is so incredibly low - yet the stakes are so incredibly high. It is hard to do because of our cargo cult of delivery and product people wanting to break works down into epics, stories and track them in ways to make internal metrics look good. Nobody wanted story points in scrum.
We are incredibly bad at our jobs - we can do so much better. But doing so likely involves not using software that makes doing this far harder. It involves reflection and determining what our job actually is and then measuring something that is relevant.
We use off the shelf solutions to problems before we have figured out what our questions are.
What is Next?
Here we have considered the time to do a single piece of work in isolation. What does this variance mean when we have multiple piece of work sequentially dependent upon one another?
It’s like the above but … multiplicative Again (except now error becomes additive …)